 ALAN PARADISE
.
July 25, 2022
.
All Feature Vehicles
ALAN PARADISE
.
July 25, 2022
.
All Feature Vehicles
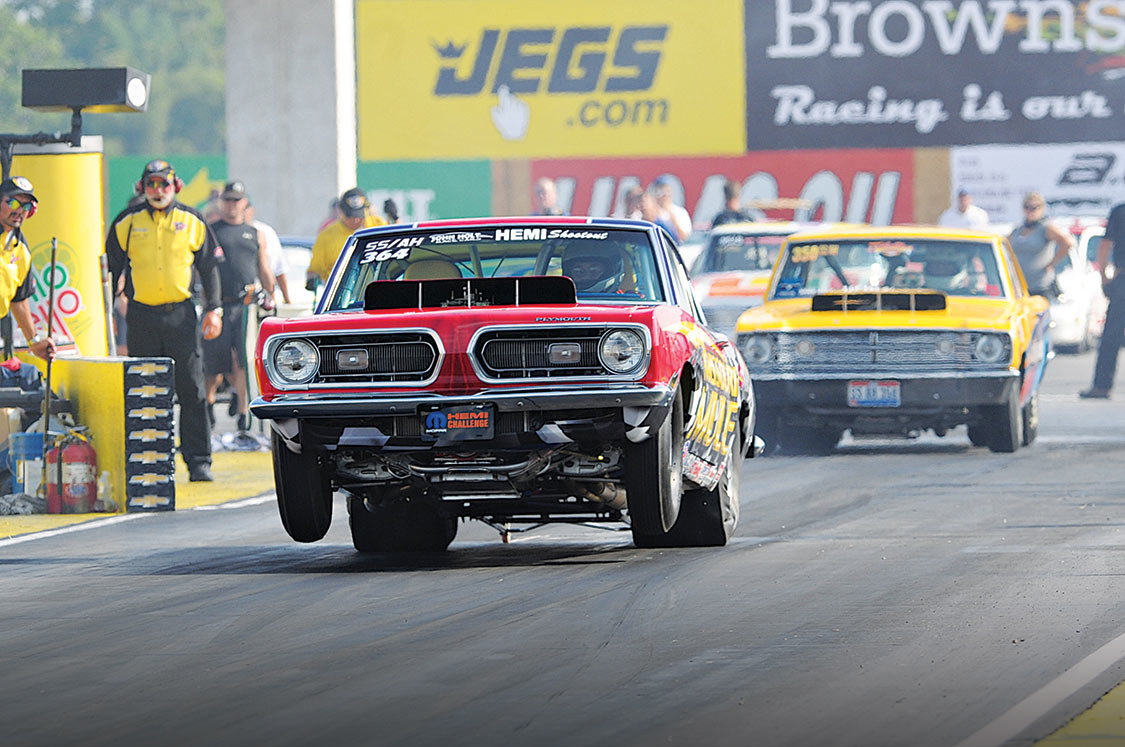
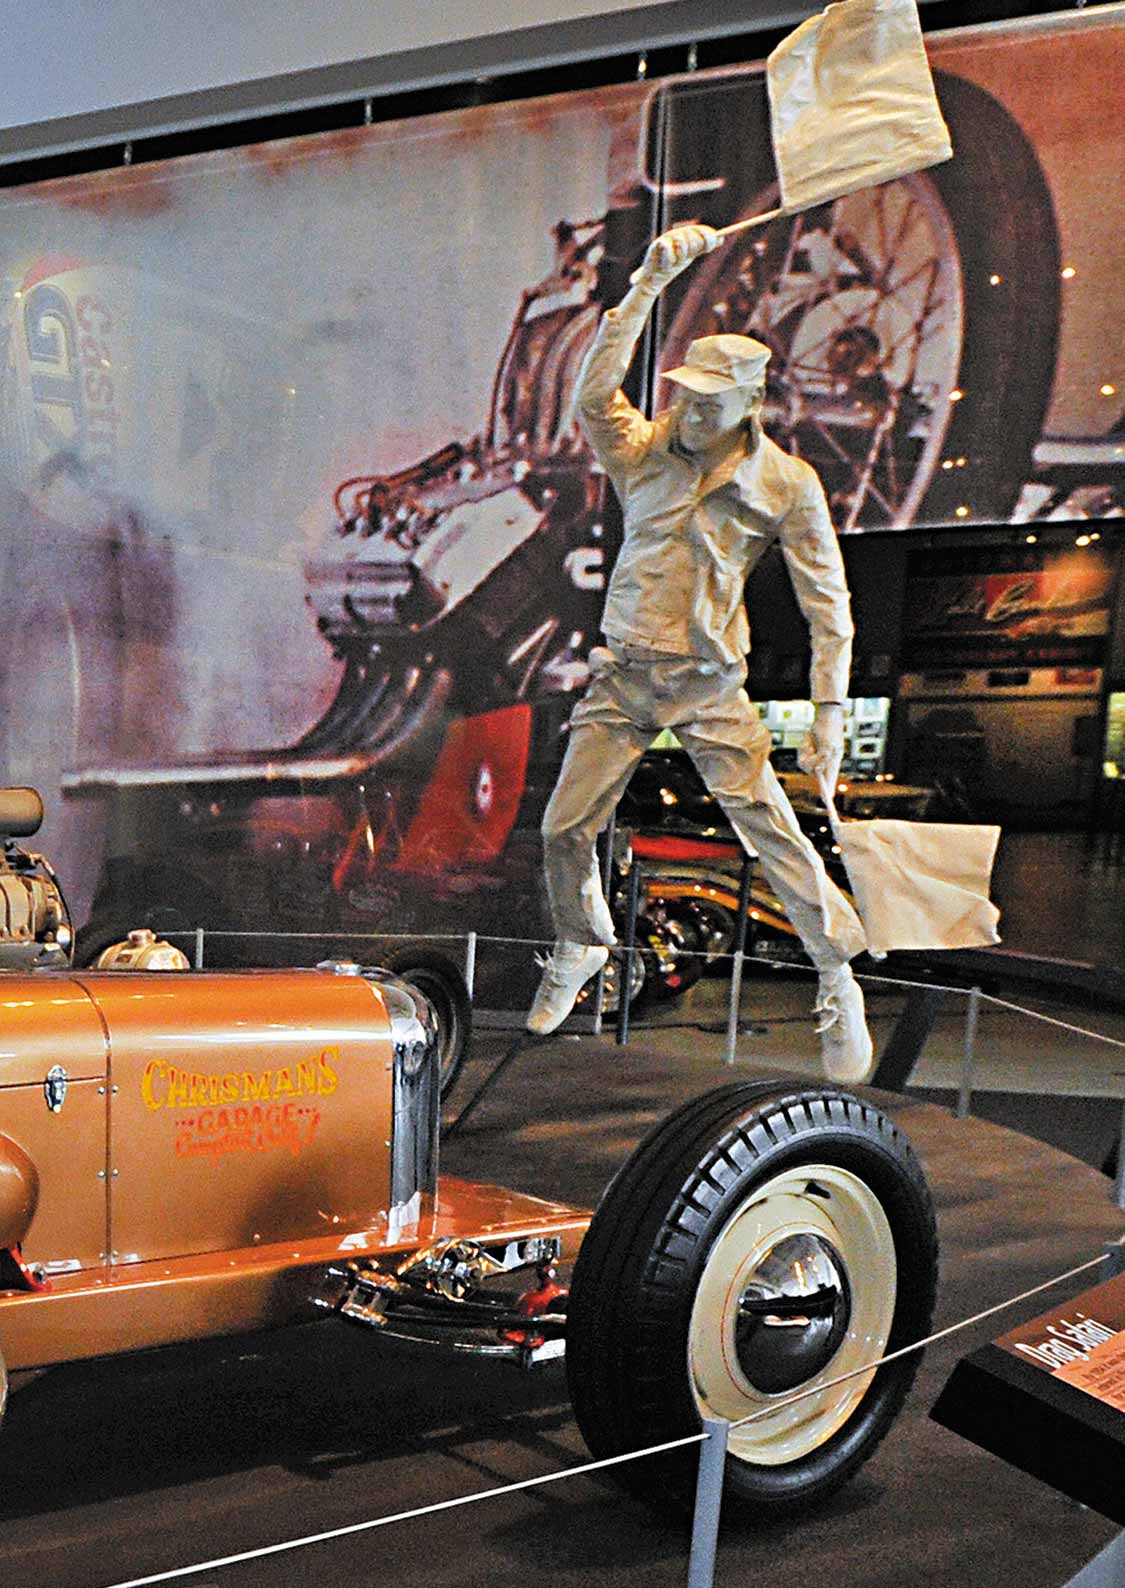
The ground shakes, the eyes burn from the expended fuel, the ears ring from unfettered exhaust—what a rush of adrenaline and emotion. As muscle car enthusiasts, we are by nature drawn to and in awe of massive horsepower. Who can resist the unmistakable whining sound of a blower competing for audible attention with a gear drive coming from a big-block SOHC Ford, Chevy Rat motor or Chrysler Elephant engine in a modified coupe, hardtop or Pony car? Or maybe we just as much fancy a small-block Chevy or Ford with a tunnel ram fitted with twin four-barrels?
Major league power can be both exhilarating and intimidating. However, performance is not always about shoehorning the most horsepower under the hood. Weight and suspension play very important parts in bringing an engine’s maximum performance to fruition. This is why a Vega transplanted with an LT-1 350 with two 600-Holleys on a tunnel ram and 4.56:1 gears can often put the hurt on a GTX with a cross-ram intake on a 440 running a 4.10 rear. Despite giving up 90-ci and likely 100-hp, the Vega is slimmed down to move 1,000 pounds less weight while gaining the advantage into and staying in the power band to optimize the engine’s potential. The key factors of power to weight, weight transference and selective gearing help make horsepower work for you.

It’s amazing how putting a car on a diet can result in improved overall performance. The easy way to relate weight to horsepower gain is to first calculate your car’s weight-to-power ratio. For example, a ’69 Camaro SS weights in at 3,480 pounds. With the factory issued 350-hp engine, that’s 9.94 pounds per horsepower. With a mild amount of aftermarket additions, for argument, let’s push the raw output to 375-hp. Each horsepower is now responsible for carrying 9.28 pounds. Now comes the million-dollar question: How much faster in the quarter-mile has this Camaro become? Answer (with all conditions and skills being equal): about four one-hundredths of a second. In other words, not much. Now, if we take the same Camaro, replace the 34-pound steel hood with an 18-pound fiberglass or carbon-fiber hood and remove the rear seat (27 pounds), we’ve just saved 45 pounds of engine labor, or roughly seven one-hundredths of a second.
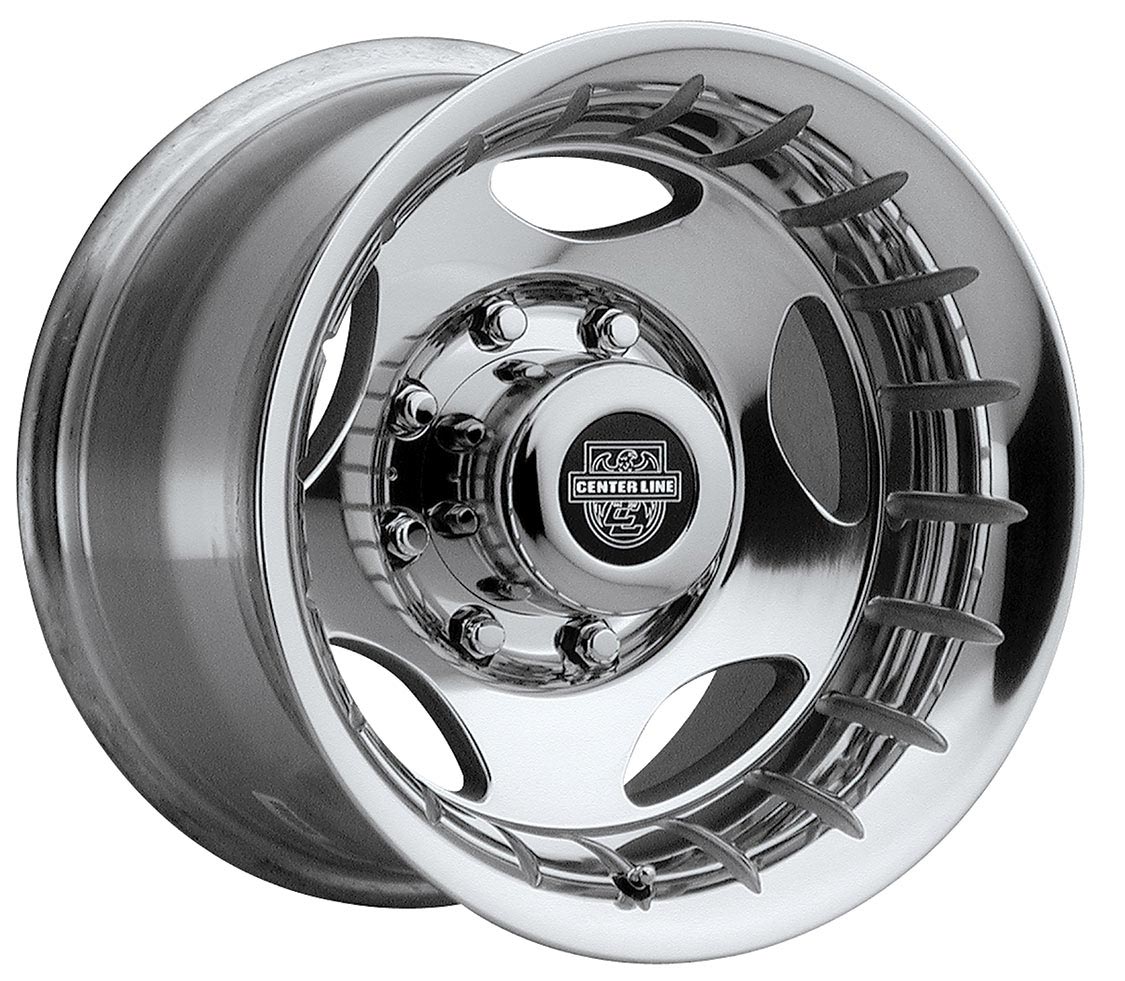
Okay, where do we go from here? The big weight mongers are those awesome-looking factory rally wheels. The average 15×7 rally wheel tips the scale, with beauty ring and center cap, at 26 pounds. If we opted for 15x8s on the rear, each weighs in at 29.5 pounds. Replacing the steel rally wheels with aftermarket aluminum can really make a big difference. Using a popular Centerline application, for example, can save 14.25 pounds per 15×7 and 16.5 pounds per 15×8. Installing aftermarket aluminum wheels trimmed more than 61 pounds of fat. Add that to the total and we reduced the engine load by 106.5 pounds. That takes about a .20 off the E.T. Now, let’s say we focused on additional performance and did nothing else to reduce weight, such as swapping in a foam-filler fuel cell, acid-dipping the front fenders and going on the Atkins Diet. For the next additional 25-hp gained, the E.T. would be cut by an additional .10 of a second. The numbers extrapolate from that point as each horsepower gain reduces the weight each is tasked with moving. Now, every ounce begins to count: headers over cast exhaust, performance heads over factory cast iron, etc.
Getting power to the pavement is essential. After all, adding horsepower and cutting weight means nothing if you can’t get the drive axles to hook up. This is where the right suspension package and chassis modifications come into play. The Gasser era came about to keep weight transferred to the rear under extreme acceleration. The front suspension offered virtually no handling capabilities. The straight axle often used leaf springs with little or no shock travel. And let’s not even get into lack of steering geometry. While it looked darn cool and did work to some small extent, it was soon discovered that the increased wind resistance and need to manhandle the car down even the smoothest of drag strips (let alone a city street) was not an equal tradeoff for a few tenths in E.T. This led to the ass-end-up formula.
More commonly referred to on the street as “the stinkbug look,” it became popular in the late-’60s and into the ’70s. It was also believed to help keep weight pushed back and held over the rear wheels under acceleration; this was often accomplished by adding air shocks to the rear combined with traction bars that limited the rotation of the solid rear axle housing under load. However, with standard front suspension springs and shocks, the lift and fall were nearly as quick, thus expending too much energy as the car made each gear change. This also hampered handling, and at times, caused the front to wobble at the bottom end of the power band. This is where the idea of 90/10 shocks and progressive rate coil springs came into play. These front suspension components helped transfer weight from the front and slowly redistributed to the front wheels with each shift change.
This didn’t last long either, as experienced chassis builders knew the secret to applying proper traction was in the relationship between suspension travel and damping resistance times tire surface and compound tempered with air pressures.
Today, more sophisticated technology and computer-enriched research and development teams have engineered suspension products and tire technology that help vintage and contemporary muscle cars achieve greater performance.

Today, more sophisticated technology and computer-enriched research and development teams have engineered suspension products and tire technology that help vintage and contemporary muscle cars achieve greater performance.
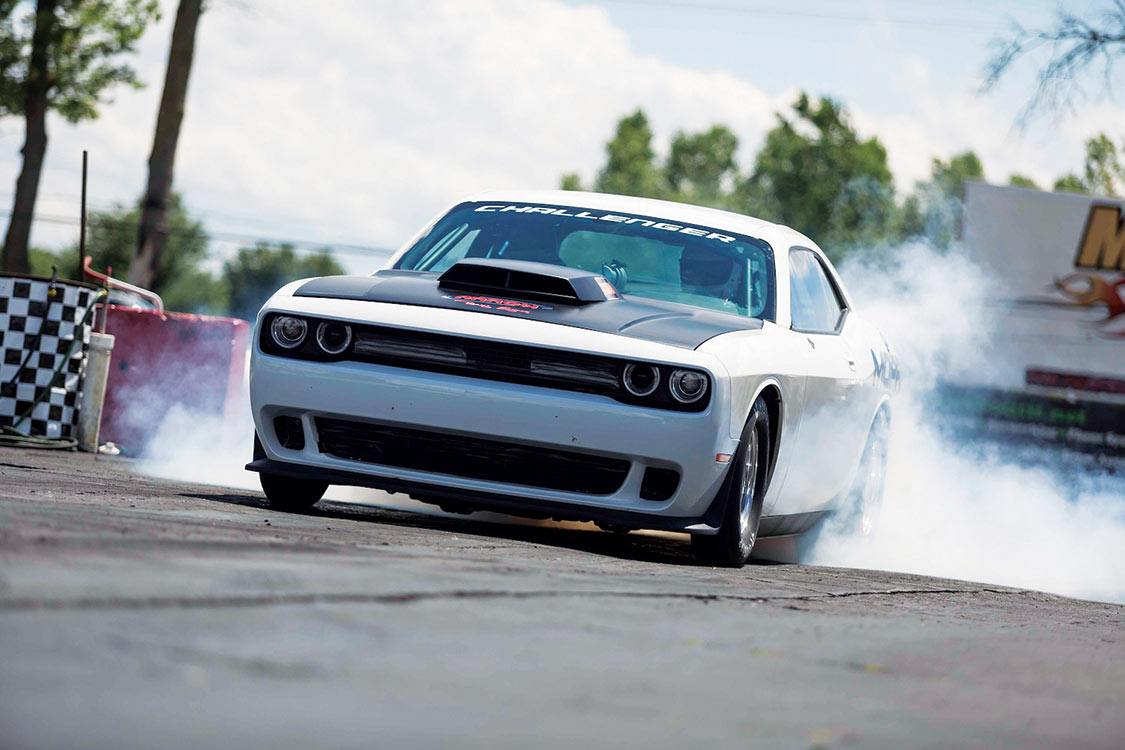
One such product is Eibach Springs’ Drag Launch Kit. The American division of this global automotive aftermarket company offers packages designed for popular Mustang and Camaro chassis, including special front coil springs that quickly transfer weight to the rear coil springs. The rear springs are designed to plant the rear tires to provide greater traction off the starting line and reduce the possibility of tire spin. A specially designed air bladder offers adjustable control over suspension twist, giving the driver improved control.
All of these suspension gymnastics mean nothing without knowledge of the power-to-weight relationship. What makes a car quick is different from what makes it fast. A quick car has a favorable power-to-weight ratio combined with proper drive gear ratios.
The subject of gear ratios brings to the table a very important question: how to determine the correct gear ratio for quarter- and eighth-mile performance? The final drive ratio of more street-driven cars is too high to maximize short distance E.T. and mile-per-hour speed. While this makes each an outstanding road vehicle, it’s also impossible for a vehicle to take full advantage of its capable horsepower between points A and B.
So, how do you determine the correct gear ratio for short run needs?
The formula for manual transmission models is:
Overall Gear Ratio = tire diameter x rpm
340 x mph
For automatic transmissions the formula is only slightly different:
Overall Gear Ratio = tire diameter x rpm
335 x mph
Correctly geared, your vehicle can trip the end lights at the peak of the power curve, putting down its optimum power throughout the run. Gear ratio becomes important because gearing too low will reach peak power before the end lights and gearing that is too high will still have the engine power on the rise after the end lights have been tripped.
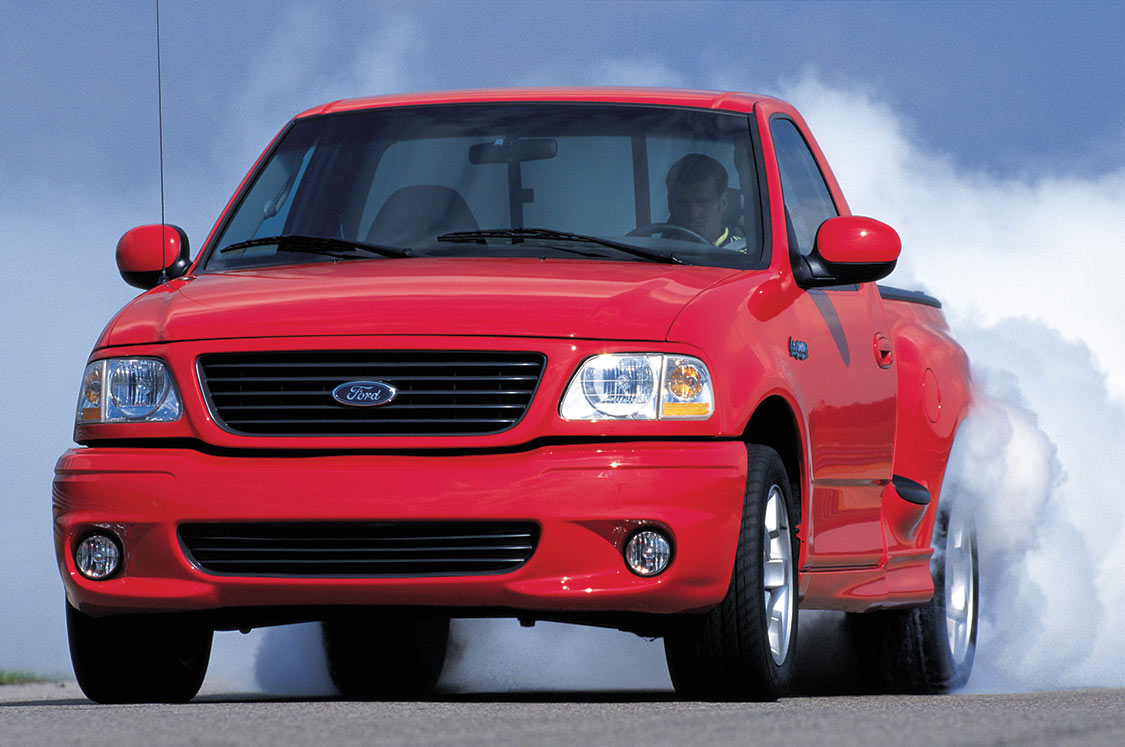
To illustrate this point, a Ford F-150 Lightning, appropriately one of the fastest factory vehicles prior to 2013, with a 7,200-rpm redline using 29-inch rear tires may need an FDR (final drive ratio) of 5.41 to achieve a 120-mph quarter-mile time. That’s some very stout gearing. In contrast, with factory tire size (28.45 inches) at 6,000 rpm redline, to reach 103 mph, the FDR would be 4.94. At 5,200 rpm the FDR is 4.12.
We could print thousands of potential power/weight/gear ratio combinations. However, all things being equal, here is a quick reference chart for determining power to weight in quarter-mile elapsed time.
|
ELAPSED TIME |
| HORSEPOWER 250 275 300 350 375 400 450 500 550 600 |
| WEIGHT |
| 1,500 10.58 10.25 9.96 9.46 9.25 9.05 8.70 8.40 8.14 7.91 |
| 2,000 11.65 11.29 10.95 10.41 10.18 9.96 9.58 9.25 8.96 8.70 |
| 2,500 12.55 12.16 11.81 11.22 10.95 10.73 10.3 2 9.96 9.65 9.37 |
| 3,000 13.34 12.92 12.55 11.92 11.65 11.40 10.96 10.58 10.25 9.96 |
| 3,500 14.04 13.60 13.21 12.55 12.26 12.00 11.54 11.14 10.79 10.49 |
| 4,000 14.68 14.22 13.81 12.12 12.82 12.55 11.54 11.29 11.07 10.86 |
|
MILE PER HOUR |
| HORSEPOWER 250 275 300 350 375 400 450 500 550 600 |
| WEIGHT |
| 1,500 128.8 132.9 136.8 144.1 147.4 150.6 156.6 162.2 167.5 172.4 |
| 2,000 117.0 120.8 124.3 130.9 133.9 136.8 142.3 147.4 152.2 156.6 |
| 2,500 108.6 112.1 115.4 121.5 124.3 127.0 132.1 136.8 141.3 145.5 |
| 3,000 102.2 105.5 108.6 114.3 117.0 119.5 124.3 128.8 132.9 136.8 |
| 3,500 97.1 100.2 103.2 108.6 111.1 113.6 118.1 122.3 126.3 130.0 |
| 4,000 92.9 95.9 98.7 103.9 106.3 108.6 113.0 117.0 120.8 124.3 |
The final aspect of this equation is rear tire circumference. Tire size is a huge factor in determining proper or necessary final drive ratio needed for the combination of driving you’re asking your car to perform.
Reading tires can be like learning a foreign language. A combination of numbers and letters separated by slash marks augmented with DOT ratings. For street-purpose tires, here’s a simplified breakdown: Going back to our ’69 Camaro as an example, the stock tire could have originally been called an F-60×15. In more modern terms, this is a 205/60/15. In some cases it could read P205/60/15. If that sounds Greek to you, here’s the translation: The “P” indicates that the tire’s size measured in metric by the width. So, 205 millimeters of tread width. The “70” is the percentage of sidewall, or tire height, in relation to the tread width. Tire height is not measured by the overall diameter of the tire, but the measurement from the top edge of the wheel to the top edge of the sidewall, in this case 143.5 millimeters. This measurement exists on both the top and bottom of the tire so multiply it by two coming up with 287 millimeters. Convert millimeters to inches by multiplying by 0.03937 to equal 11.3 inches. Add this to the wheel size of 15 inches to find the overall diameter of 26.3 inches. If this were a lower profile tire, say a 205/60/15, the tire height would be 60% of the tread width, or 136.66 millimeters, changing the overall size of the tire to 25.76 inches.
Track tires, especially rear tires, are often taller than the factory issued or aftermarket street performance applications. Track tires have the overall diameter as part of the sidewall specification, such as 15×33 is 33 inches tall made to fit a 15-inch wheel. This is very important because the overall tire diameter plays a major role in determining the final drive ratio.
Getting back to our hypothetical Camaro, it has 375 hp, the weight is 3,200 pounds, running 4.11 gears and 30-inch rear tires. So, what can we expect it to run in the quarter-mile? Taking into account an approximately 17% loss in energy as power runs through the M-22 four-speed transmission, turns the driveshaft and rear axles, this could mean, under optimum conditions, our Camaro should trip the lights in 13.35 seconds with a top speed of 112.75 mph.
This is very respectable for a dual-purpose (street and strip) muscle car. If we were to strip the car down for track, only use 2,800 pounds and pump up the horsepower to 500, the times could drop to about 11.5 at 123 mph. However, lost would be the joy of having the option of driving the quick little Camaro on the street.
In the end, it all comes down to what you want out of your muscle car: street, strip or show, or perhaps a combination of two or all three. Either way, the excitement of driving is being able to get the ponies to the pavement.
All Feature Vehicles
How Harley Earl Changed the World It was just another bleak late winter’s day in Detroit. The year was 1927 and a brash Californian had… Continue reading
ALAN PARADISE . July 27, 2022

All Feature Vehicles
Power increase demands quick clutch upgrade In its 11th year, Gary Winter’s 2003 Mustang Mach 1 received an upgraded clutch. In itself, that’s not remarkable.… Continue reading
Titus Bloom . June 05, 2022
All Feature Vehicles
Winternational held at Auto Club Raceway in Pomona, California The drag racing season kicks off every year at the NHRA Mello Yello Drag Racing Series. The… Continue reading
Roger Rohrdanz . February 02, 2023
All Feature Vehicles
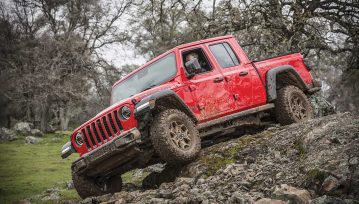
Jeep hits the trail with the Wrangler JT Gladiator Pick-up At the end of World War II, Willys Overland emerged as a major player in… Continue reading
CHRIS COLLARD . January 02, 2023
All Feature Vehicles
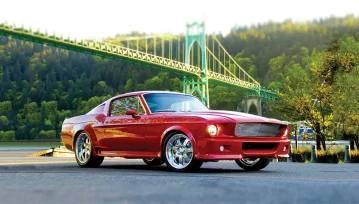
Brad Selland’s excellent Mustang spares no detail There are a lot of older Ford Mustangs still around and they are still very popular. Brad Selland… Continue reading
Dan Burrill . March 06, 2023
All Feature Vehicles
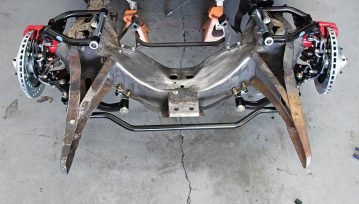
Bringing a Tri-Five Chevy’s Suspension up to Modern Standards Upgrading the front suspension on a Tri-Five Chevy sedan used to mean replacing the entire chassis… Continue reading
MARCEL VENABLE . May 30, 2022


Classics With The Cardinals, Santa Barbara’s Premier Car Show
Bishop Diego High School - Football Field 4000 La Colina Rd
Goodguys 35th Speedway Motors Heartland Nationals Presented By FiTech Fuel Injection
Iowa State Fairgrounds 3000 East Grand Avenue, Des Moines, IA 50317
Goodguys 28th Summit Racing Nationals Presented By Grundy Insurance
Ohio Expo Center 717 East 17th Avenue, Columbus, OH 43211
Stray Angels Show & Shine
Stray Angels Show & Shine at Melrose Vineyards 885 Melqua Rd. Roseburg OR. 97471
43rd Annual Stray Angels Show & Shine
Melrose Vineyards, Roseburg, Oregon
We use cookies to enhance your browsing experience, serve personalized ads or content, and analyze our traffic. By clicking "Accept All", you consent to our use of cookies. Visit our Cookie Policy for more info.
 Please wait...
Share Link